Referral Intelligence
Referral Intelligence
Referral Intelligence
An AI growth platform for orthodontists, who live on referrals from general dentists. I took the founder's working MVP and redesigned it from a data report into a weekly plan of who to call and why, then built the brand on top.
Impact:
2 design directions explored, one approved, in 5 days
18% more active referring dentists across pilot practices after 90 days
6 core screens redesigned, plus full brand identity
An AI growth platform for orthodontists, who live on referrals from general dentists. I took the founder's working MVP and redesigned it from a data report into a weekly plan of who to call and why, then built the brand on top.
Impact:
2 design directions explored, one approved, in 5 days
18% more active referring dentists across pilot practices after 90 days
6 core screens redesigned, plus full brand identity
The problem: An orthodontic practice can see that referrals from a dentist dropped. It can't see why, or what to do about it, and nobody on staff has time to find out. The MVP had all the data (referrals, CRM notes, dentist survey answers) and showed it as charts. It answered "what happened" and stopped there.
The problem: An orthodontic practice can see that referrals from a dentist dropped. It can't see why, or what to do about it, and nobody on staff has time to find out. The MVP had all the data (referrals, CRM notes, dentist survey answers) and showed it as charts. It answered "what happened" and stopped there.
Key decisions:
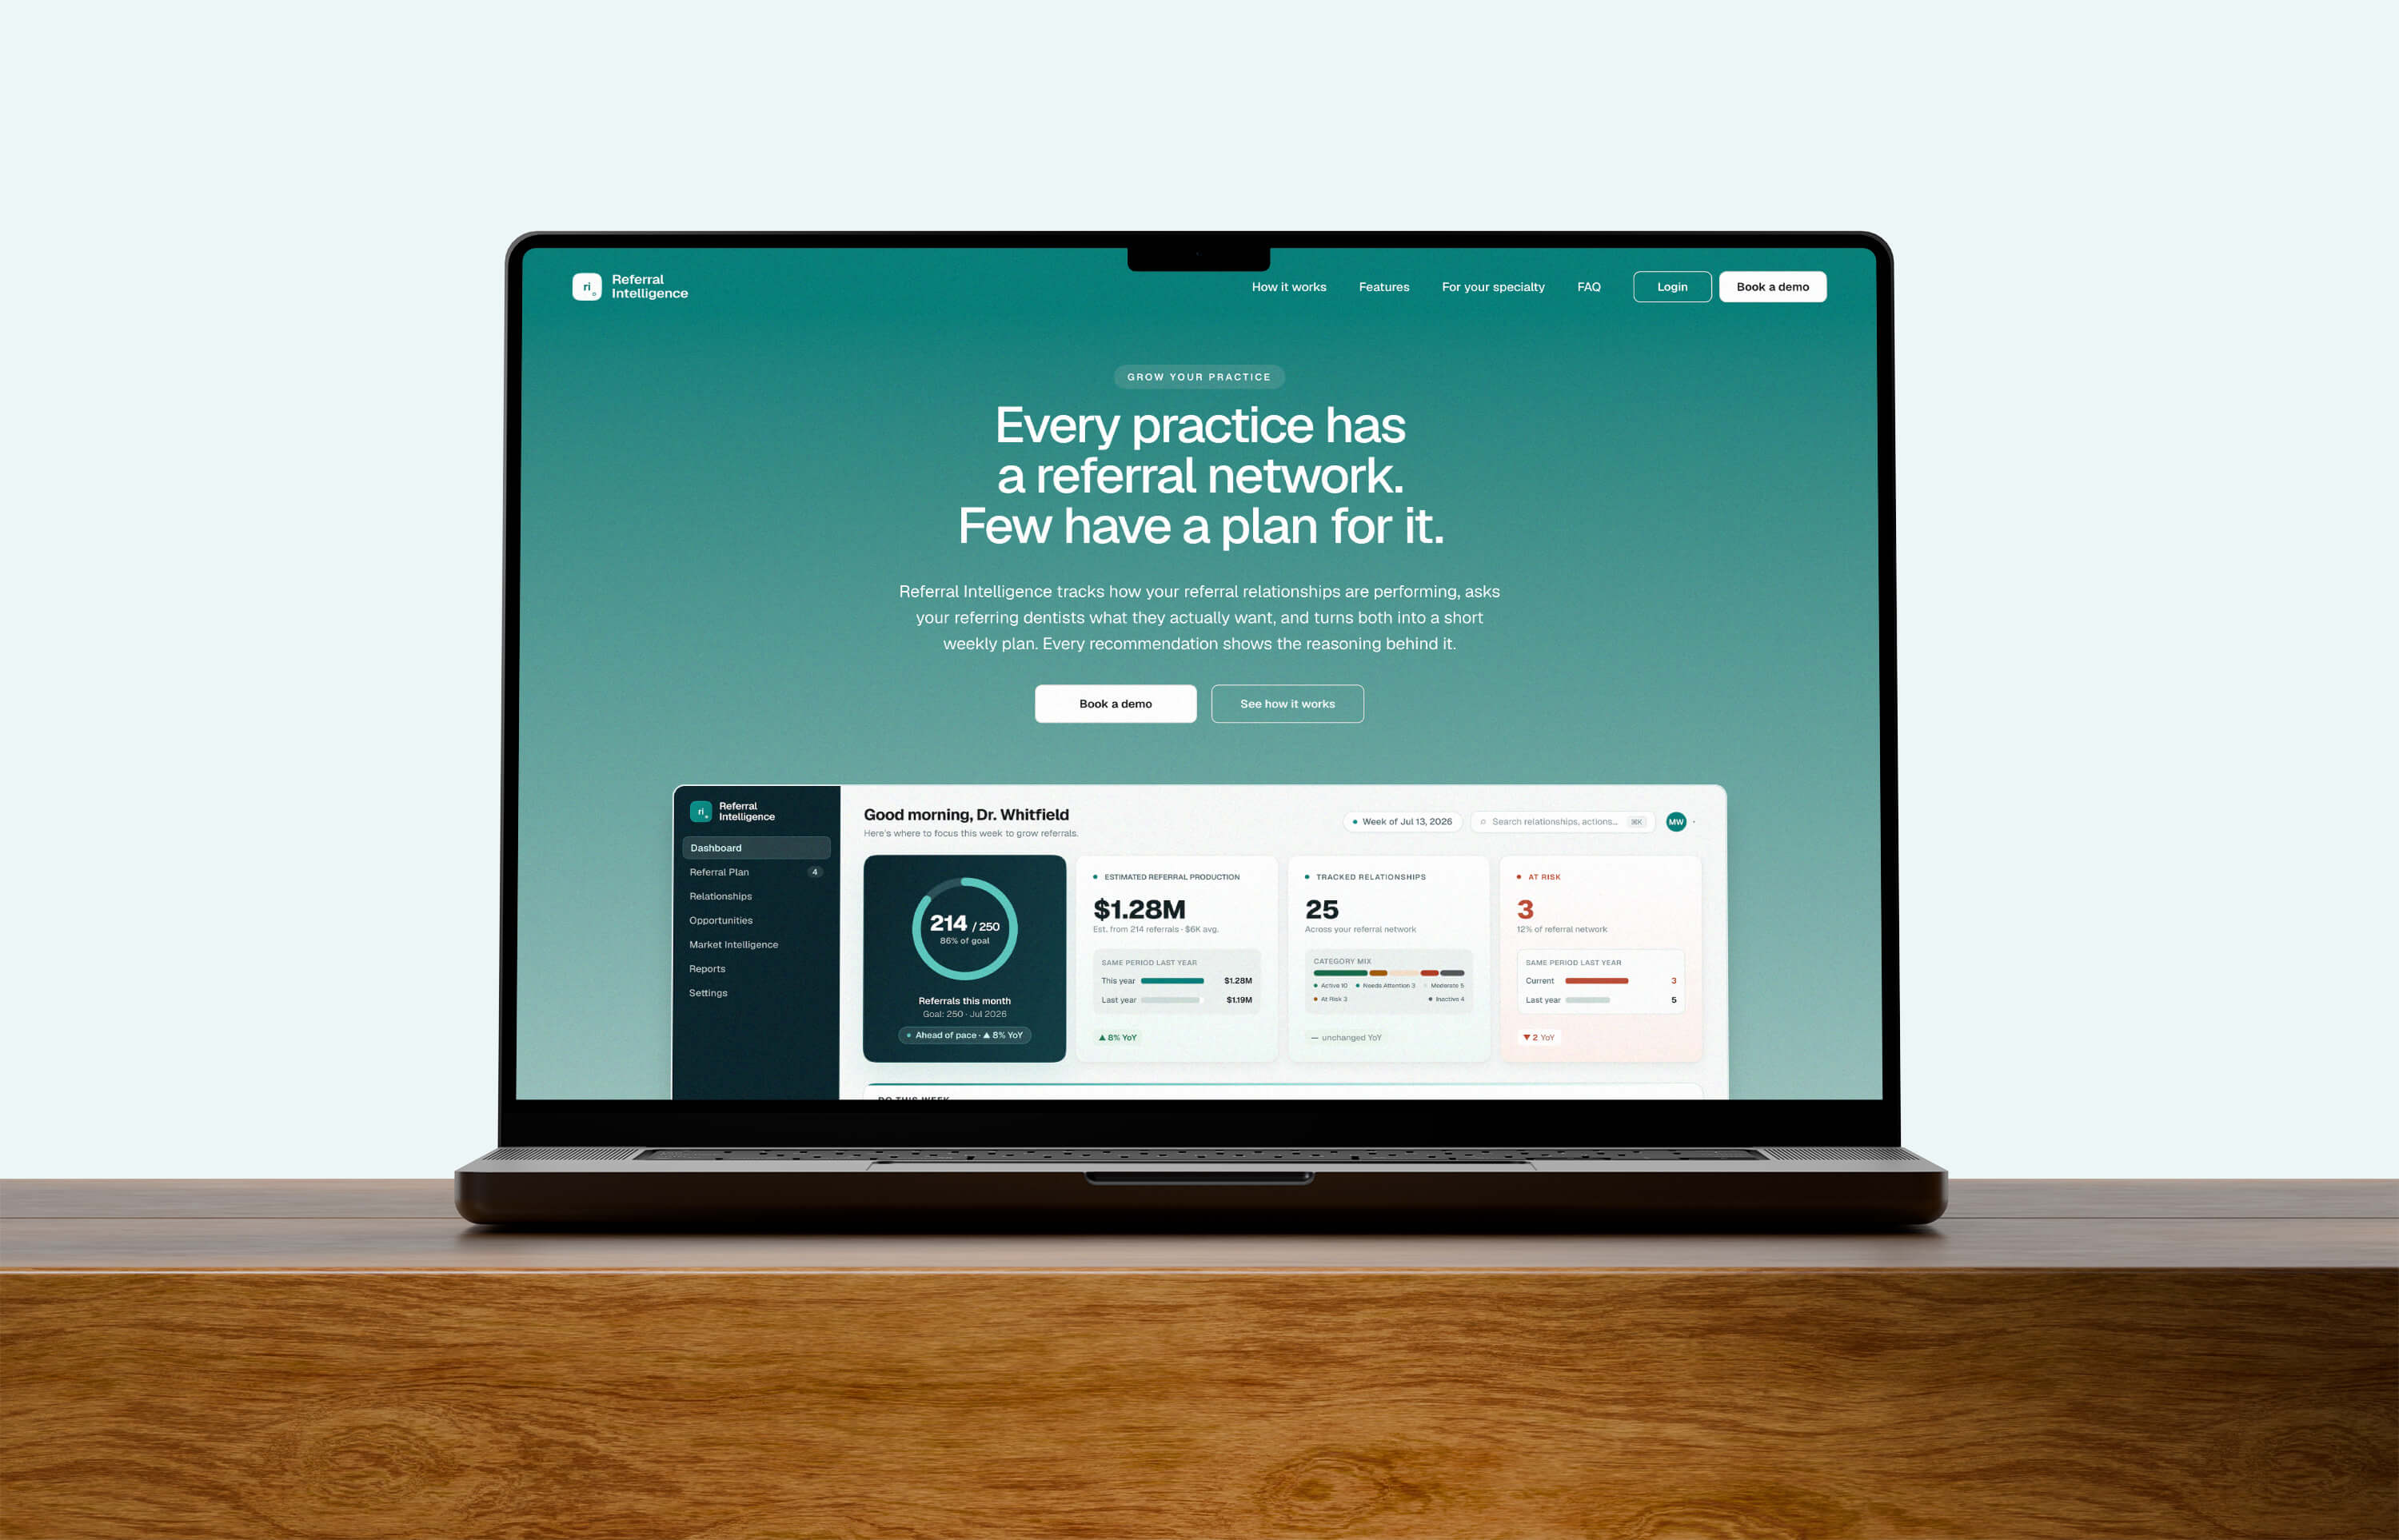
1. Three questions, in order. The dashboard reads top to bottom as: how is my practice doing, who needs attention, what do I do next. The headline KPI became a single ring showing referrals against the monthly goal (e.g. 214 of 250). Cards that didn't serve one of those questions, like start rate, were cut.
2. Compare year over year, not month over month. Referrals are seasonal. Month-over-month made every normal summer dip look like a crisis, so the default comparison moved to last year.
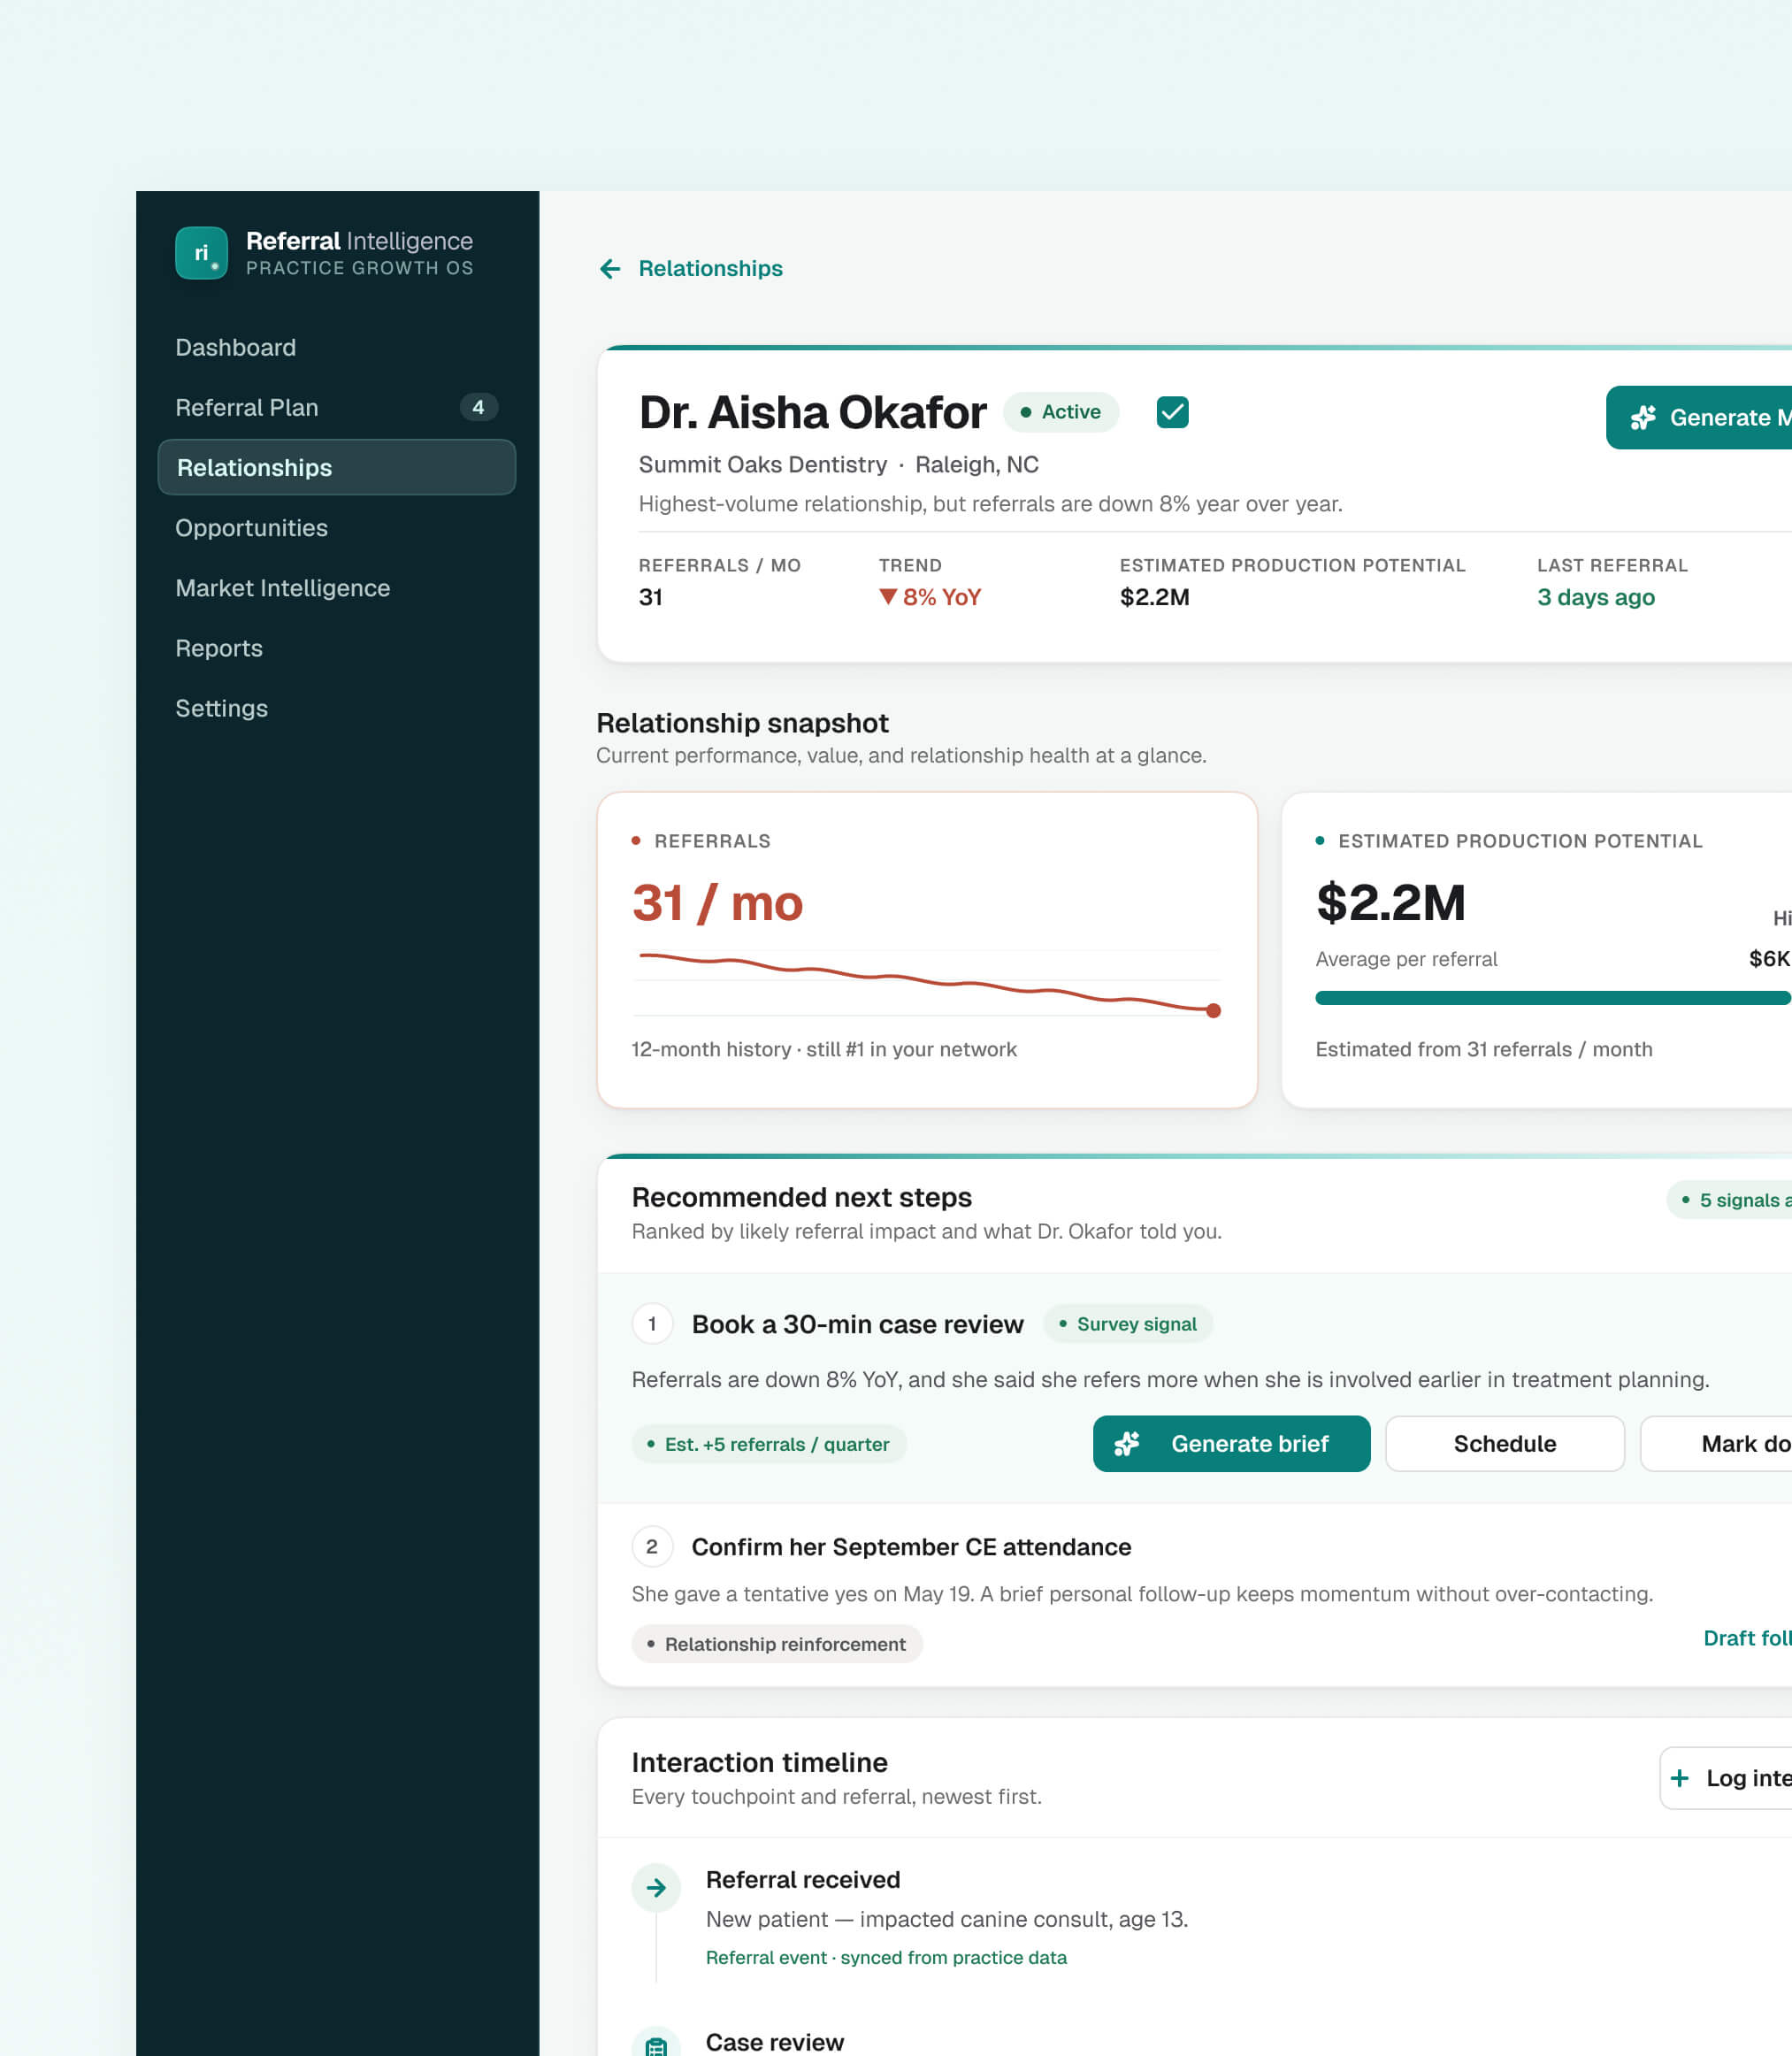
3. Every action shows its reason. "Do this week" pairs a named dentist with the signal behind the suggestion: a survey answer, a referral drop, a missed visit. It became the founder's favorite part of the product.
Key decisions:
1. Three questions, in order. The dashboard reads top to bottom as: how is my practice doing, who needs attention, what do I do next. The headline KPI became a single ring showing referrals against the monthly goal (e.g. 214 of 250). Cards that didn't serve one of those questions, like start rate, were cut.
2. Compare year over year, not month over month. Referrals are seasonal. Month-over-month made every normal summer dip look like a crisis, so the default comparison moved to last year.
3. Every action shows its reason. "Do this week" pairs a named dentist with the signal behind the suggestion: a survey answer, a referral drop, a missed visit. It became the founder's favorite part of the product.
Results: Practices completed 72% of suggested weekly actions, and building a weekly outreach plan went from 40 minutes in spreadsheets to 10 minutes in the product.
Results: Practices completed 72% of suggested weekly actions, and building a weekly outreach plan went from 40 minutes in spreadsheets to 10 minutes in the product.




@ 2026 Kirill Pikalov